

 English
 norsk
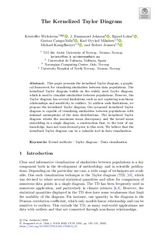
norskThe Kernelized Taylor Diagram
| dc.contributor.author | Wickstrøm, Kristoffer | |
| dc.contributor.author | Johnson, Juan Emmanuel | |
| dc.contributor.author | Løkse, Sigurd Eivindson | |
| dc.contributor.author | Camps-Valls, Gusatu | |
| dc.contributor.author | Mikalsen, Karl Øyvind | |
| dc.contributor.author | Kampffmeyer, Michael | |
| dc.contributor.author | Jenssen, Robert | |
| dc.date.accessioned | 2023-02-23T07:47:55Z | |
| dc.date.available | 2023-02-23T07:47:55Z | |
| dc.date.issued | 2023-02-02 | |
| dc.description.abstract | This paper presents the kernelized Taylor diagram, a graphical framework for visualizing similarities between data populations. The kernelized Taylor diagram builds on the widely used Taylor diagram, which is used to visualize similarities between populations. However, the Taylor diagram has several limitations such as not capturing non-linear relationships and sensitivity to outliers. To address such limitations, we propose the kernelized Taylor diagram. Our proposed kernelized Taylor diagram is capable of visualizing similarities between populations with minimal assumptions of the data distributions. The kernelized Taylor diagram relates the maximum mean discrepancy and the kernel mean embedding in a single diagram, a construction that, to the best of our knowledge, have not been devised prior to this work. We believe that the kernelized Taylor diagram can be a valuable tool in data visualization. | en_US |
| dc.identifier.citation | Wickstrøm KK, Johnson JE, Løkse S, Camps-Valls, Mikalsen KØ, Kampffmeyer MC, Jenssen R. The Kernelized Taylor Diagram. Communications in Computer and Information Science. 2022;1650 | en_US |
| dc.identifier.cristinID | FRIDAID 2080693 | |
| dc.identifier.doi | 10.1007/978-3-031-17030-0_10 | |
| dc.identifier.issn | 1865-0929 | |
| dc.identifier.issn | 1865-0937 | |
| dc.identifier.uri | https://hdl.handle.net/10037/28598 | |
| dc.language.iso | eng | en_US |
| dc.publisher | Springer | en_US |
| dc.relation.journal | Communications in Computer and Information Science | |
| dc.rights.accessRights | openAccess | en_US |
| dc.rights.holder | Copyright 2022 The Author(s) | en_US |
| dc.rights.uri | https://creativecommons.org/licenses/by/4.0 | en_US |
| dc.rights | Attribution 4.0 International (CC BY 4.0) | en_US |
| dc.title | The Kernelized Taylor Diagram | en_US |
| dc.type.version | publishedVersion | en_US |
| dc.type | Journal article | en_US |
| dc.type | Tidsskriftartikkel | en_US |
| dc.type | Peer reviewed | en_US |
File(s) in this item
This item appears in the following collection(s)

Except where otherwise noted, this item's license is described as Attribution 4.0 International (CC BY 4.0)