Illustrating Complex Mappings with Excel
| dc.contributor.author | Haugland, Ole Anton | |
| dc.date.accessioned | 2023-03-27T08:35:58Z | |
| dc.date.available | 2023-03-27T08:35:58Z | |
| dc.date.issued | 2023 | |
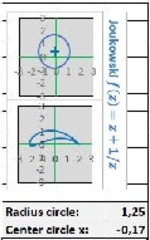
| dc.description.abstract | It seems to be a well-kept secret even among mathematicians and scientists that Microsoft Excel can handle complex numbers and functions. This gives easy access to complex arithmetic for a broad audience. Complex functions like sine, exponential and hyperbolic functions are built-in functions in Excel. Together with Excels great graphical capabilities this makes it a nice tool for illustrating complex mappings. I have made three sample applications. One is just a simple demonstration, one is a tool for experimenting with different elementary complex mappings and one is a tool for experimenting with the Joukowski transformation. | en_US |
| dc.identifier.uri | https://hdl.handle.net/10037/28863 | |
| dc.rights.accessRights | openAccess | en_US |
| dc.title | Illustrating Complex Mappings with Excel | en_US |
| dc.type | Others | en_US |
| dc.type | Andre | en_US |


 English
 norsk
norsk